 General Tech
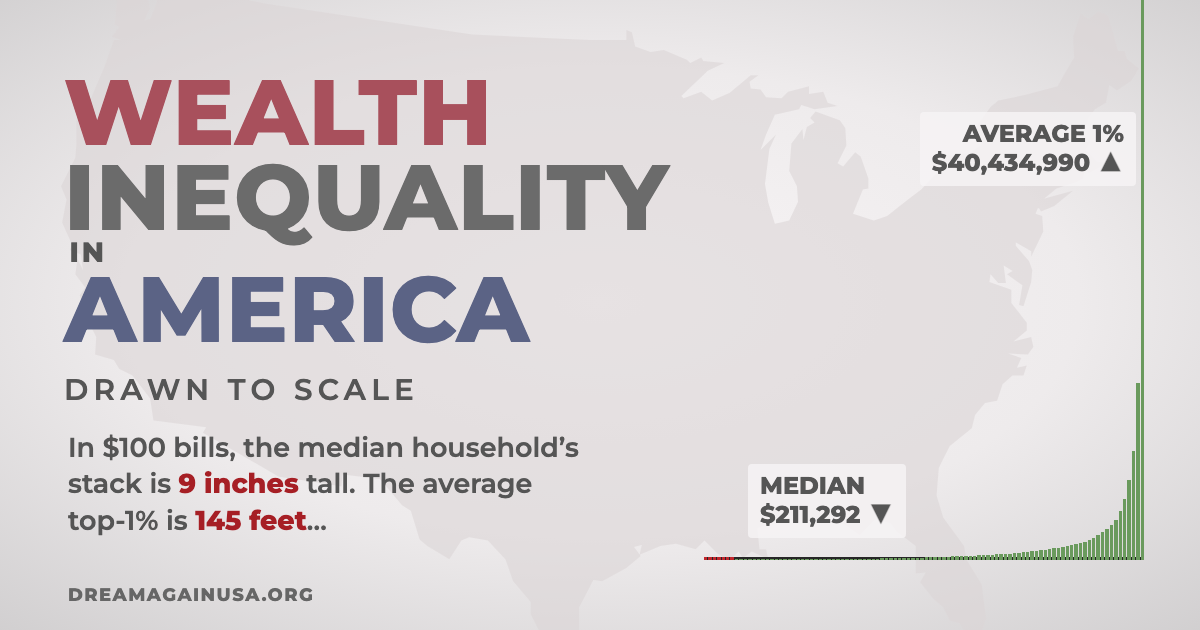
Wealth Inequality in America drawn to scale
The graph shows the distribution of U.S. household wealth, with each column representing 1% of households, from poorest to richest. The top 1% of households have an average net worth of $10.4 million, with the median household's net worth being around $170,000. The graph displays the wealth inequality in the U.S., with the top 1% holding a significant portion of the country's wealth. The graph is available as a free PDF for download and can be used to visualize the wealth gap.
Read the full article at dreamagainusa.org →